


Women GPs continue to experience other gender-based personal and professional disadvantages.
There are multiple ways of conceptualising and estimating the gender pay gap, including this study from Ochre health.
Every. Single. Time. I present the data, I get questioned about whether these figures are “accurate”. As though an “accurate” number makes it more “real”.
However, no matter how we calculate the gap, and no matter what the percentage is, the gap exists and it always goes in the same direction: women GPs are worse off financially.
It’s not that they work less, the gap continues when we calculate the gap against hourly pay.
The reasons have been obvious for years – longer, more complex cognitive work is undervalued in the Medicare Schedule. Women do longer consultations, with more complex, cognitive work.
Put more simply, “women’s work” is invisible, undervalued and exploited.
To be crystal clear, it is not the fault of my male colleagues. Just as I’m capable of procedural work, they are equally capable of emotional labour, empathy and deep complexity.
It’s the community who makes assumptions about Lady Doctors that just happen to lead to more emotional labour and significant financial disadvantage for women GPs.
A common criticism is that women choose to have more elastic boundaries, less efficient business practices and fewer hours, and longer consultations are a choice.
These criticisms ignore a fundamental sociological truth, that across all disciplines, and all professions, from veterinary science to dentistry, “lady doctors” are seen to be kinder, more compassionate, more willing to provide cut price services for the needy, and more able to understand mental health and complex care.
If the community chooses their preferred health professional, female GPs will continue to see people needing complex care, including those with women’s health and mental health needs, and requiring longer, less lucrative consultations.
If this “women’s work” was valued, the difference in the type of work we do wouldn’t matter. Unfortunately, it isn’t.
The financial disadvantage and increase in emotional labour leads to attrition of female doctors, a common problem for women doctors across the world, including India, Canada, the US, the UK and Australia. In fact, there is some American data that suggests women physicians increase the life of their patients, but they reduce their own longevity.
Another way of considering how time is “donated”.
Recently, federal health minister Mark Butler was asked about “Medicare Misogyny”, and commented that recent Medicare changes had helped to get things “just about right”.
No, they haven’t.
He also commented that there was no hard data.
So, in the interests of caring and sharing, here are the graphs. There are plenty more. But let’s start here.
Understanding the GP workforce
Australian GP workforce data shows male GPs constitute 49% of the GP workforce, and 56% of the full-time equivalent workforce. The proportion of GPs to the population is falling, with120 GPs per 100 000 population in 2020, compared with 112 in 2025.
Substantial investment in other services, such as pharmacy prescribing, urgent care clinics and others, shift the focus of GPs away from straightforward consultations to more complex care.
Related


The impact of the complex care on income
There are structural impediments to complex care that have always existed in the MBS Schedule. Clearly, the optimal income is obtained if consultations are kept (very) short. The following graph shows this impact over time.1
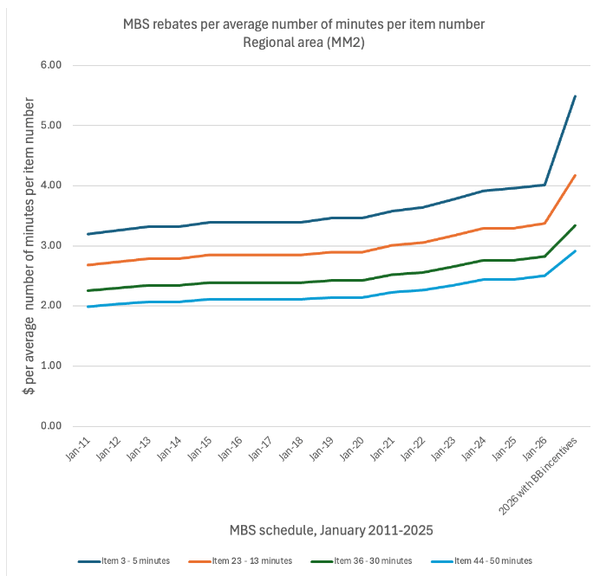
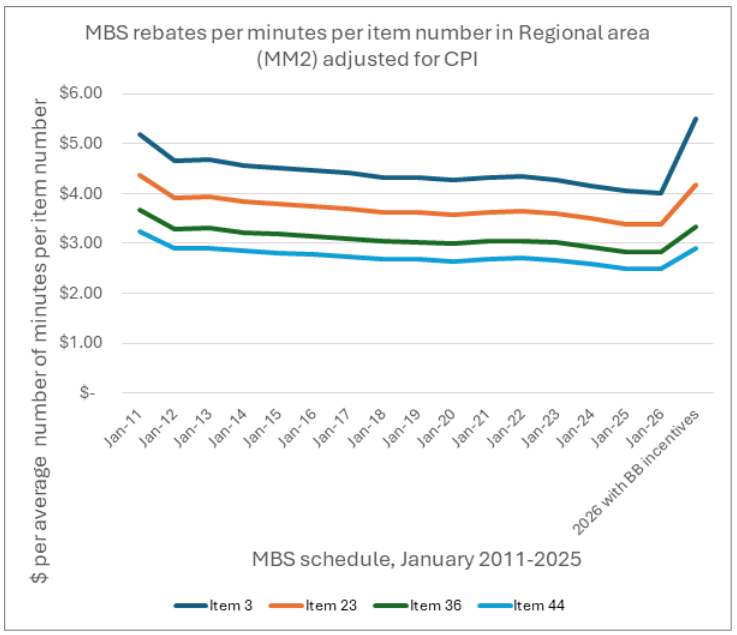
In CPI-adjusted terms, the rebates have steadily declined. The bulk billing bonus takes Item 3 up to slightly above its 2011 value and all of the other items up to less than the 2011 value. 2
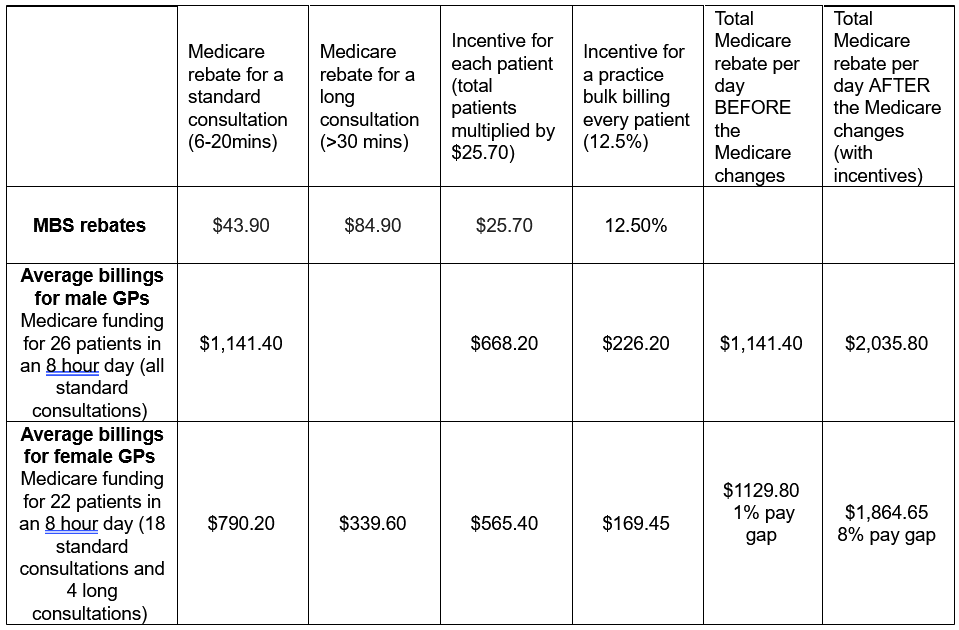
The Australian GP workforce data indicate that male GPs see an average of 26 patients per day while women see an average of 22 patients per day. Critically, the Medicare changes implemented in November 2025 have increased the gender pay gap from 1% to 8% on rebates alone (see table 1, below).
The difference between average male and female GP rebates before and after Medicare changes in November 2025
The ATO figures in 2022 show an average male GP income of $226 927 and average female GP income of $171 087- showing a 26% gender pay gap.
Gender pay gaps in other professions
Most gender pay gap calculations do not take into account the differences in working hours between genders.
This graph (below) uses the health workforce data set to calculate the average number of working hours by gender and then uses the data from the individual taxation statistics from the ABS to calculate the average income per full time equivalent by gender. Surprisingly, the gender pay gap has worsened for some professions, including pathology, but has improved for others.
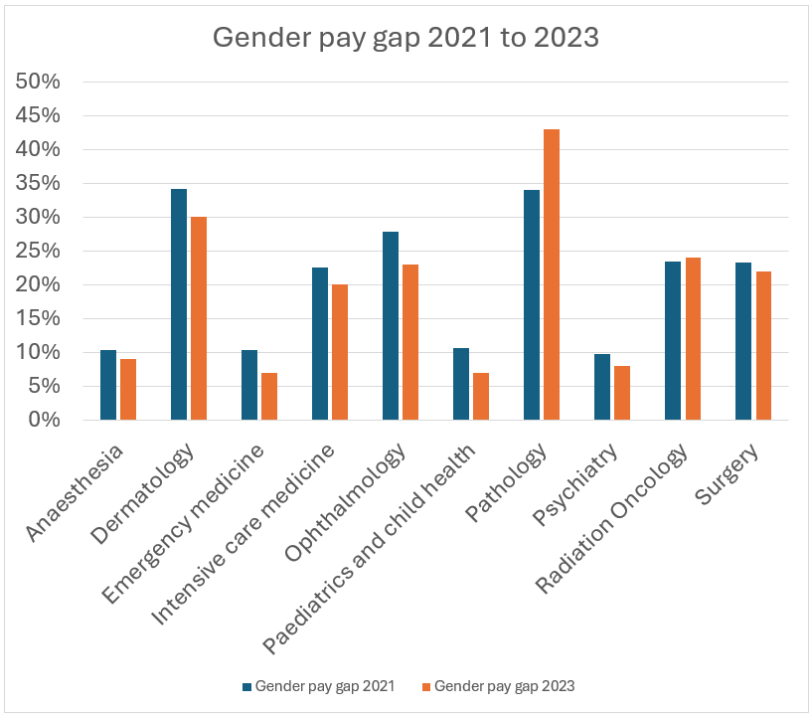
It’s not much better across the other professions, although nurses seem to be sorting things out a bit.
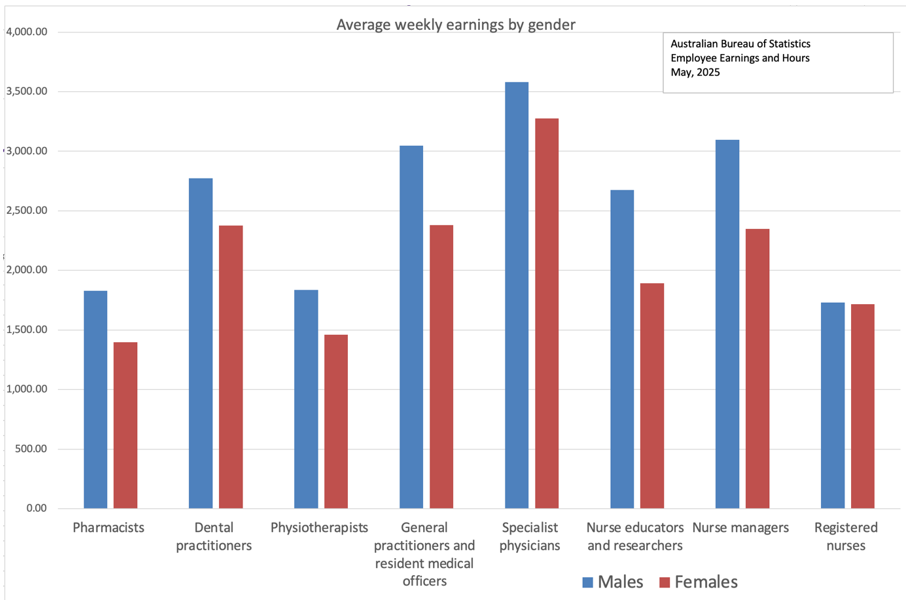
However, once you differentiate between types of nurses, the gender pay gap is back.
It is difficult to find the average full-time equivalent hours by gender in all professions, so the gender pay gap of other health professions can only be calculated against their average total income, supplied by the ABS.
Nevertheless, I could find no profession where the gender pay gap disappeared.
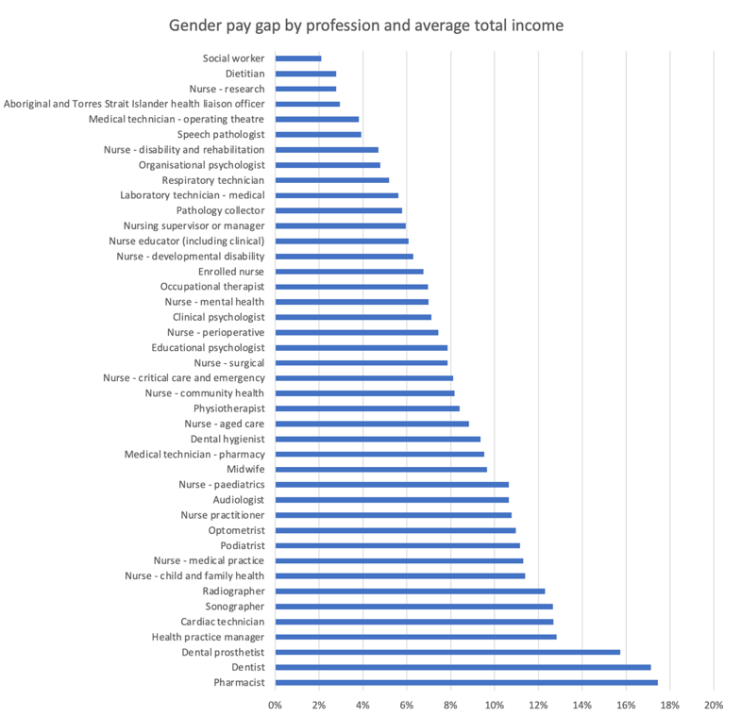
So yes, the gender pay gap is real, persistent and deeply unjust. I can find more graphs.
But the data isn’t impacting policy. In fact, recent policy changes are making things worse.
There MUST be health economists in the Department of Health, Ageing and Disability who are better at graphs than I am, but for some reason, the data is not being used.
If we can pay salaried doctors the same per minute regardless of their work, I don’t see why general practice isn’t the same. A minute of complex healthcare, no matter what the focus, should be supported with the same subsidy as a minute of more straightforward healthcare.
It’s not rocket science, (although rocket scientists don’t seem to have solved the problem either with a gap of around 40%).
The gender pay gap in general practice is obvious and persistent, no matter how it is measured.
At its heart is the devaluing of the complex cognitive and emotional labour GPs need to manage patients with mental health, gender-based violence, women’s health and multimorbidity.
I don’t know what various governments are worried about. It’s not as though women GPs are likely to go feral and suddenly, I don’t know, listen for longer for no reason.
But that is precisely why, I assume, we privilege consultations that are clearly too short to do what women GPs do.
Let’s not forget, it’s not the only gender gap. Women GPs continue to experience other gender-based personal and professional disadvantages.
So can we please get on with addressing this highly visible and clearly articulated problem? Or do we need even more graphs?
Professor Louise Stone is a GP in Canberra and an academic at Adelaide University. A collection of her research, policy and teaching materials can be found at drlouisestone.com.
1The charts assume (in the absence of other reliable statistical data) expected durations for Item 3 (3-6 minutes) are 5 minutes; Item 23 (6-20 minutes) are 15 minutes; Item 36 (30-45 minutes) are 45 minutes; and Item 44 (45-60 minutes) are 50 minutes. If higher durations are chosen, the difference between items is increased.
2The rebate is expressed in 2026 dollars calculated in each year as the nominal rebate multiplied by the ratio of CPI (CPI in a year divided by CPI in 2026).
